K-Means Clustering

K-Means Clustering एक Unsupervised Learning Algorithm है जो डेटा को k अलग-अलग clusters में बांटने का कार्य करता है, जहाँ हर cluster में डाले गए डेटा आपस में एक-दूसरे से अधिक समान होते हैं।

उदाहरण:
आप एक दुकान के ग्राहकों को उनके ख़रीदने की आदतों के आधार पर 3 समूहों में बाँटना चाहते हैं — High, Medium, और Low spenders।


🔶 उद्देश्य:

K-Means का लक्ष्य है:

Data Points को इस तरह से बांटना कि प्रत्येक Cluster का “Centroid” अपने Points से न्यूनतम दूरी पर हो।


📐 Mathematical Objective:

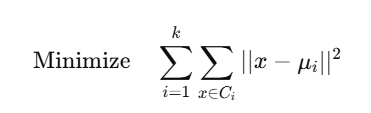
K-Means का Loss Function (Inertia) होता है:
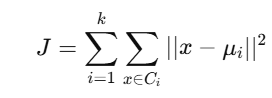
जहाँ:


🧠 Algorithm Steps:

  1. kkk initial centroids randomly चुनें
  2. हर point को सबसे पास वाले centroid के cluster में assign करें
  3. हर cluster का नया centroid calculate करें
  4. Step 2 और 3 को तब तक दोहराएं जब तक cluster assignment stable ना हो जाए

✅ Python Code (with Visualization):

from sklearn.cluster import KMeans
import matplotlib.pyplot as plt
import numpy as np

# Dummy Data
X = np.array([[1, 2], [1, 4], [1, 0],
[10, 2], [10, 4], [10, 0]])

# KMeans Model
model = KMeans(n_clusters=2, random_state=0)
model.fit(X)

# Output
print("Labels:", model.labels_) # Cluster assignments
print("Centroids:", model.cluster_centers_) # Cluster centers

# Visualization
plt.scatter(X[:, 0], X[:, 1], c=model.labels_, cmap='viridis')
plt.scatter(model.cluster_centers_[:, 0], model.cluster_centers_[:, 1],
c='red', marker='X', s=200, label='Centroids')
plt.title("K-Means Clustering")
plt.xlabel("Feature 1")
plt.ylabel("Feature 2")
plt.legend()
plt.grid(True)
plt.show()

🔬 Elbow Method (Best k कैसे चुनें?)

Elbow Method यह देखने में मदद करता है कि कितने clusters लेने से सबसे अच्छी grouping मिलेगी।

📈 Plot Inertia vs k:

inertia = []
K = range(1, 10)

for k in K:
km = KMeans(n_clusters=k)
km.fit(X)
inertia.append(km.inertia_)

plt.plot(K, inertia, marker='o')
plt.xlabel('Number of Clusters k')
plt.ylabel('Inertia (Within Sum of Squares)')
plt.title('Elbow Method for Optimal k')
plt.show()

जहाँ graph में “elbow” बनता है — वही optimal k होता है।


🔎 Real Life Applications:

DomainApplication Example
MarketingCustomer Segmentation
HealthcareDisease pattern clustering
FinanceRisk Grouping / Fraud Detection
E-commerceProduct Recommendation (user grouping)

⚖️ K-Means के फायदे और नुकसान:

✅ फायदे:

  • Simple और Fast
  • High-dimensional data पर काम करता है
  • Easily scalable

❌ नुकसान:

  • kkk पहले से पता होना चाहिए
  • Non-spherical clusters को handle नहीं कर पाता
  • Outliers पर sensitive होता है
  • Local minima में फँस सकता है (initial centroid पर निर्भरता)

📊 Summary Table:

FeatureK-Means
TypeUnsupervised Clustering
InputOnly Features (No Labels)
OutputCluster IDs
Distance MetricEuclidean Distance (Mostly)
SpeedFast
Shape AssumptionSpherical Clusters

📝 Practice Questions:

  1. K-Means का उद्देश्य क्या होता है?
  2. Loss function J का अर्थ क्या है?
  3. Elbow Method का क्या उपयोग है?
  4. K-Means कब खराब perform करता है?
  5. K-Means clustering में initialization क्यों महत्वपूर्ण होता है?

Unsupervised Learning Algorithms

Unsupervised Learning वह तकनीक है जहाँ हमें केवल input data दिया जाता है, लेकिन उसके साथ कोई label या output नहीं होता।

Model को खुद से patterns, structure, clusters या associations को सीखना होता है


🧠 उपयोग की परिस्थितियाँ:

Supervised LearningUnsupervised Learning
X (input) + Y (label)केवल X (input)
Spam Detection, Price PredictionCustomer Segmentation, Anomaly Detection

🔑 उद्देश्य:

Unsupervised Learning का मुख्य उद्देश्य है:

  • Hidden patterns खोजना
  • Similar data points को एक साथ ग्रुप करना
  • Dimensionality को घटाना
  • Outlier या anomaly detect करना

🔬 प्रमुख Algorithms:

Algorithmउद्देश्यउदाहरण
K-Means ClusteringSimilarity के आधार पर group बनानाCustomer Segmentation
Hierarchical ClusteringTree structure में groupingGenetic Analysis
DBSCANDensity-based clusteringOutlier Detection
PCA (Principal Component Analysis)Dimensionality ReductionImage Compression
AutoencodersFeature Compression (DL-based)Anomaly Detection
t-SNE / UMAPVisualization (2D mapping)Data Plotting

🔷 1. K-Means Clustering

🎯 उद्देश्य:

डाटा को k समूहों (clusters) में बाँटना, जहाँ हर group का center “centroid” होता है।

📐 Mathematical Objective:

जहाँ:


✅ Python Code (Sklearn):

from sklearn.cluster import KMeans
import matplotlib.pyplot as plt

X = [[1,2], [1,4], [1,0], [10,2], [10,4], [10,0]]
model = KMeans(n_clusters=2)
model.fit(X)

print(model.labels_) # Cluster IDs
print(model.cluster_centers_)

plt.scatter(*zip(*X), c=model.labels_)
plt.scatter(*zip(*model.cluster_centers_), c='red', marker='x')
plt.title("K-Means Clustering")
plt.show()

🔷 2. Hierarchical Clustering

📌 विशेषताएँ:

  • Agglomerative: Bottom-up approach
  • Dendrogram के रूप में output मिलता है

✅ Code (SciPy):

from scipy.cluster.hierarchy import dendrogram, linkage
import matplotlib.pyplot as plt

X = [[1,2], [2,3], [10,12], [11,14]]
Z = linkage(X, method='ward')

dendrogram(Z)
plt.title("Hierarchical Clustering Dendrogram")
plt.show()

🔷 3. DBSCAN (Density-Based Spatial Clustering)

📌 लाभ:

  • Arbitrary shape के clusters बना सकता है
  • Outliers को अलग कर सकता है

🔷 4. PCA (Principal Component Analysis)

📌 उद्देश्य:

High-dimensional data को कम dimensions में प्रोजेक्ट करना।

📐 PCA Formula:

Data matrix X को transform करते हैं: Z=XW

जहाँ:

  • W: Principal components (eigenvectors of covariance matrix)
  • Z: Reduced dimensional representation

✅ PCA Code:

from sklearn.decomposition import PCA
from sklearn.datasets import load_iris
import matplotlib.pyplot as plt

iris = load_iris()
X = iris.data
pca = PCA(n_components=2)
X_reduced = pca.fit_transform(X)

plt.scatter(X_reduced[:,0], X_reduced[:,1], c=iris.target)
plt.title("PCA of Iris Dataset")
plt.show()

📊 Summary Table:

Algorithmउद्देश्यOutputVisualization
K-MeansClusteringCluster Labels
HierarchicalClustering Tree (Dendrogram)Cluster Tree
DBSCANDensity-Based ClusteringLabels + Outliers
PCADimension ReductionCompressed Data
AutoencodersNeural CompressionEncoded Data❌ (Complex)

📝 Practice Questions:

  1. Unsupervised Learning में labels क्यों नहीं होते?
  2. K-Means का objective function क्या है?
  3. PCA कैसे dimension को reduce करता है?
  4. DBSCAN और K-Means में क्या अंतर है?
  5. Hierarchical Clustering में Dendrogram क्या दर्शाता है?

Naive Bayes Algorithm

Naive Bayes एक probability-based classification algorithm है जो Bayes’ Theorem पर आधारित है।
यह विशेष रूप से text classification (जैसे spam detection, sentiment analysis) में बहुत उपयोगी होता है।


🔶 Naive Bayes का मूल सिद्धांत:

इसका आधार है Bayes’ Theorem, जो किसी घटना की posterior probability निकालने के लिए prior probability और likelihood का उपयोग करता है।

📐 Bayes’ Theorem:

जहाँ:

  • P(C∣X): Class C की probability दी गई input X के लिए
  • P(X∣C): Class C में X के आने की संभावना
  • P(C): Class C की prior probability
  • P(X): Input X की total probability

🎯 Naive Assumption:

Naive Bayes “naive” इस कारण कहलाता है क्योंकि यह मान लेता है कि:

सभी features एक-दूसरे से स्वतंत्र (independent) हैं, यानी


🔍 Types of Naive Bayes:

TypeUse CaseFeature Type
Gaussian Naive BayesContinuous values (e.g., height)Numerical
Multinomial NBText classification (e.g., spam)Discrete counts
Bernoulli NBBinary features (yes/no)Boolean

🔬 Gaussian Naive Bayes Formula:

यदि कोई feature xxx continuous है, तो हम मानते हैं कि वह Gaussian distribution को follow करता है:

जहाँ


🔧 Sklearn में Naive Bayes Code:

from sklearn.naive_bayes import GaussianNB

model = GaussianNB()
model.fit(X_train, y_train)

y_pred = model.predict(X_test)

📄 Text Classification (Multinomial Naive Bayes) Example:

from sklearn.feature_extraction.text import CountVectorizer
from sklearn.naive_bayes import MultinomialNB

texts = ["spam offer now", "buy cheap", "hello friend", "how are you"]
labels = [1, 1, 0, 0] # 1=spam, 0=ham

vectorizer = CountVectorizer()
X = vectorizer.fit_transform(texts)

model = MultinomialNB()
model.fit(X, labels)

test = vectorizer.transform(["cheap offer"])
print(model.predict(test)) # Output: [1]

📌 Advantages:

✅ Fast और memory-efficient
✅ Probabilistic interpretation (confidence level मिलता है)
✅ Text और NLP tasks में अच्छा काम करता है
✅ कम data पर भी अच्छा perform करता है


⚠️ Limitations:

❌ Independence assumption हमेशा सही नहीं होती
❌ Complex datasets में Accuracy कम हो सकती है
❌ Continuous features पर Gaussian assumption जरूरी होता है


📊 Summary Table:

ElementDescription
Based OnBayes’ Theorem
AssumptionFeature Independence
OutputProbabilities (0 to 1)
ApplicationsSpam Detection, NLP, Document Classify
SpeedVery Fast

📝 Practice Questions:

  1. Naive Bayes का “naive” नाम क्यों पड़ा?
  2. Bayes’ Theorem का formula क्या है और उसका अर्थ समझाइए।
  3. Gaussian Naive Bayes में likelihood कैसे निकाला जाता है?
  4. Multinomial और Bernoulli Naive Bayes में क्या अंतर है?
  5. Naive Bayes को कब उपयोग नहीं करना चाहिए?

Support Vector Machines (SVM)


SVM (Support Vector Machine) एक शक्तिशाली classification algorithm है जो high-dimensional spaces में भी शानदार performance देता है।

यह algorithm कोशिश करता है कि classes के बीच सबसे चौड़ा margin (boundary) बने।


🔶 क्या है SVM?

SVM एक ऐसा मॉडल है जो अलग-अलग class के data points के बीच सबसे best decision boundary (hyperplane) बनाता है।

🎯 उद्देश्य:

Class 0 और Class 1 को इस तरह से अलग करना कि उनके बीच का फासला (margin) अधिकतम हो।


📊 उदाहरण:

Data PointFeature 1Feature 2Class
A230
B451
C340

SVM इसे इस तरह से classify करता है कि class boundaries के पास के points (Support Vectors) अधिकतम दूर हों।


🧠 महत्वपूर्ण Concepts:

TermMeaning
HyperplaneDecision boundary जो classes को अलग करता है
MarginHyperplane से सबसे नजदीक के points तक की दूरी
Support Vectorsवही points जो margin को define करते हैं
Kernel TrickNon-linear data को linear बनाने की तकनीक

🔄 Linear vs Non-Linear SVM:

TypeUse Case
Linear SVMजब data साफ़-साफ़ linearly separable हो
Non-Linear SVMजब data का pattern complex हो — इसे kernels से solve करते हैं (RBF, Polynomial etc.)

🔧 Scikit-learn में SVM का Implementation:

✅ Linear SVM (with linearly separable data):

from sklearn.svm import SVC

model = SVC(kernel='linear')
model.fit(X_train, y_train)

y_pred = model.predict(X_test)

✅ Non-Linear SVM (with RBF Kernel):

model = SVC(kernel='rbf')  # Gaussian kernel
model.fit(X_train, y_train)

🔬 Kernel Functions:

KernelDescription
LinearStraight line boundary
PolynomialPolynomial-based curved boundary
RBF (Gaussian)Smooth, flexible boundary for complex data
SigmoidSimilar to neural network activation

📊 SVM vs अन्य Algorithms:

FeatureSVMDecision TreeLogistic Regression
Works in High Dim✅ Yes❌ No❌ No
Handles Non-linearity✅ via kernel✅ with tuning❌ Not naturally
Explainability❌ Difficult✅ Yes✅ Yes
Overfitting❌ Less prone✅ More prone✅ Moderate

✅ Visualization (2D Example with Python)

rom sklearn import datasets
from sklearn.svm import SVC
import matplotlib.pyplot as plt
import numpy as np

# Load dummy data
X, y = datasets.make_blobs(n_samples=100, centers=2, random_state=6)

# Train SVM
clf = SVC(kernel='linear')
clf.fit(X, y)

# Plot
plt.scatter(X[:, 0], X[:, 1], c=y)
ax = plt.gca()

# Plot decision boundary
xlim = ax.get_xlim()
ylim = ax.get_ylim()
xx = np.linspace(xlim[0], xlim[1])
yy = np.linspace(ylim[0], ylim[1])
YY, XX = np.meshgrid(yy, xx)
xy = np.vstack([XX.ravel(), YY.ravel()]).T
Z = clf.decision_function(xy).reshape(XX.shape)
ax.contour(XX, YY, Z, levels=[-1, 0, 1], linestyles=['--', '-', '--'])
plt.title("SVM Decision Boundary")
plt.show()

📌 कब उपयोग करें SVM?

✅ जब:

  • Feature dimension बहुत ज़्यादा हो
  • Classes के बीच separation जरूरी हो
  • Small dataset हो लेकिन complex pattern हो

📝 Practice Questions:

  1. SVM का मुख्य उद्देश्य क्या होता है?
  2. Support Vectors क्या होते हैं और उनका क्या role है?
  3. Kernel trick कैसे काम करती है?
  4. Linear और Non-linear SVM में क्या अंतर है?
  5. Decision Tree और SVM में क्या अंतर है?

Decision Trees & Random Forest


🔷 परिचय:

Decision Trees और Random Forest Supervised Learning के दो बहुत लोकप्रिय और शक्तिशाली एल्गोरिद्म हैं।
ये विशेष रूप से तब उपयोगी होते हैं जब हमें explainable और interpretive मॉडल चाहिए होते हैं।

आप सोचिए एक इंसान कैसे फैसला करता है?
अगर “Age > 30” है → फिर “Income > ₹50k” → फिर निर्णय लें
ऐसा ही काम करता है Decision Tree.


🔶 1. Decision Tree (निर्णय वृक्ष)

📌 क्या है?

Decision Tree एक ट्री-आधारित मॉडल है जो डेटा को विभाजित (Split) करता है ताकि decision तक पहुँचा जा सके।

📊 उदाहरण:

              आयु > 30?
/ \
हाँ नहीं
/ \
वेतन > 50k? No
/ \
हाँ नहीं
Yes No

✅ विशेषताएँ:

विशेषताविवरण
Model TypeClassification या Regression
Input DataStructured tabular data
OutputClass label या Continuous value
Splitting BasisGini, Entropy, या MSE
Explainabilityबहुत अच्छी

🛠️ Decision Tree कैसे बनता है?

  1. Dataset के किसी feature पर split करो
  2. Split के बाद Impurity कम होनी चाहिए (Gini या Entropy)
  3. यही recursively करते हुए tree expand होता है
  4. Leaf nodes पर final class या value तय होती है

✅ स्किकिट-लर्न (Scikit-Learn) कोड:

from sklearn.tree import DecisionTreeClassifier

model = DecisionTreeClassifier(criterion='gini') # या entropy
model.fit(X_train, y_train)

y_pred = model.predict(X_test)

🔷 2. Random Forest (रैंडम फॉरेस्ट)

📌 क्या है?

Random Forest एक ensemble learning तकनीक है जो कई Decision Trees को मिलाकर एक मजबूत मॉडल बनाती है।

एक Decision Tree = एक डॉक्टर की राय
Random Forest = 100 डॉक्टरों की राय का औसत
अधिक Trees → बेहतर फैसला


✅ विशेषताएँ:

विशेषताविवरण
Algorithm TypeBagging (Bootstrap Aggregation)
Model StrengthHigh Accuracy, Low Variance
Overfittingकम होता है
Decision MethodVoting (Classification) / Averaging (Regression)

🛠️ कैसे काम करता है?

  1. Dataset से random sampling के कई subsets बनते हैं
  2. हर subset पर एक अलग Decision Tree train होता है
  3. Prediction के समय: सभी trees की राय ली जाती है
  4. Final prediction: Majority Vote या Average

✅ स्किकिट-लर्न कोड:

from sklearn.ensemble import RandomForestClassifier

model = RandomForestClassifier(n_estimators=100, criterion='gini')
model.fit(X_train, y_train)

y_pred = model.predict(X_test)

🔍 Decision Tree vs Random Forest

विशेषताDecision TreeRandom Forest
AccuracyMediumHigh
Overfitting RiskHighLow
ExplainabilityHighLow
SpeedFastSlower (more trees)
Use CasesSimple decision makingHigh performance tasks

📊 Summary Table:

AlgorithmTypeStrengthCommon Use Cases
Decision TreeSingle ModelEasy to interpretCredit scoring, Rules
Random ForestEnsembleRobust, less overfittingMedical diagnosis, Finance

📝 Practice Questions:

  1. Decision Tree किस principle पर काम करता है?
  2. Entropy और Gini Index में क्या अंतर है?
  3. Random Forest overfitting से कैसे बचाता है?
  4. Decision Tree explainable क्यों माना जाता है?
  5. एक real-life use case बताइए जहाँ Random Forest बेहतर है।