
PCA (Principal Component Analysis) एक statistical technique है जो high-dimensional data को कम dimensions में project करके उसका meaningful structure retain करती है।
उदाहरण के लिए:
अगर आपके पास 100 features हैं, लेकिन असल में केवल 2 features पूरे pattern को explain कर सकते हैं — तो PCA उन्हीं 2 को चुनता है।
🔶 उद्देश्य:
- Features की संख्या को घटाना (Dimensionality Reduction)
- Data में मौजूद variance को अधिकतम बनाए रखना
- Visualization को आसान बनाना
- Noise को घटाना और Model को Fast बनाना
📐 Core Idea (Mathematical):
PCA का लक्ष्य होता है:
ऐसे नए axes (Principal Components) खोजना जो original data में सबसे अधिक variance को capture करें।
🎯 Objective:
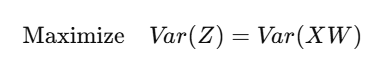
जहाँ:
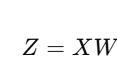
- X: Centered data matrix
- W: Projection matrix (eigenvectors)
- Z: Projected data (principal components)
🧮 Step-by-Step Working:
Standardize the Data
(mean = 0, std = 1)
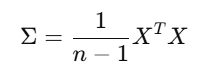
Covariance Matrix Calculate करो
Eigenvalues और Eigenvectors निकालो
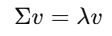
Top-k Eigenvectors को चुनो (सबसे बड़ी eigenvalues वाले)
Data को Project करो new space में:
✅ Python Code (Sklearn + Visualization):
from sklearn.decomposition import PCA
from sklearn.datasets import load_iris
import matplotlib.pyplot as plt

# Load sample data
data = load_iris()
X = data.data
y = data.target

# PCA with 2 components
pca = PCA(n_components=2)
X_pca = pca.fit_transform(X)

# Plot
plt.figure(figsize=(8,6))
plt.scatter(X_pca[:,0], X_pca[:,1], c=y, cmap='viridis')
plt.xlabel("Principal Component 1")
plt.ylabel("Principal Component 2")
plt.title("PCA: Iris Dataset")
plt.grid(True)
plt.show()
📊 Explained Variance:
PCA बताता है कि हर component कितना information retain करता है:
print(pca.explained_variance_ratio_)
उदाहरण Output:
[0.9246, 0.0530] → यानी कुल 97.76% variance केवल 2 components से explain हो गया
🔎 कब इस्तेमाल करें PCA?
| Case | उपयोग |
|---|---|
| बहुत सारे features हों | ✅ |
| Model slow या overfit कर रहा हो | ✅ |
| Feature correlation ज़्यादा हो | ✅ |
| Features sparse हों (जैसे TF-IDF) | ✅ |
⚠️ Limitations:
| Limitation | Explanation |
|---|---|
| Interpretability कम हो जाती है | PCs original features से अलग होते हैं |
| केवल linear patterns detect करता है | Complex nonlinear pattern नहीं देख सकता |
| Scaling आवश्यक है | बिना scaling result गलत हो सकता है |
📊 Summary Table:
| Feature | PCA |
|---|---|
| Type | Dimensionality Reduction |
| Preserves | Maximum Variance |
| Based On | Eigenvalues & Eigenvectors |
| Suitable For | High-dimensional, numeric data |
| Output | Reduced dimension components |
📝 Practice Questions:
- PCA का उद्देश्य क्या होता है?
- Covariance matrix किस लिए बनाई जाती है?
- Eigenvectors और Eigenvalues का क्या अर्थ है PCA में?
- Explained Variance Ratio क्या दर्शाता है?
- PCA कब काम नहीं करता?