
Unsupervised Learning वह तकनीक है जहाँ हमें केवल input data दिया जाता है, लेकिन उसके साथ कोई label या output नहीं होता।
Model को खुद से patterns, structure, clusters या associations को सीखना होता है।
🧠 उपयोग की परिस्थितियाँ:
| Supervised Learning | Unsupervised Learning |
|---|---|
| X (input) + Y (label) | केवल X (input) |
| Spam Detection, Price Prediction | Customer Segmentation, Anomaly Detection |
🔑 उद्देश्य:
Unsupervised Learning का मुख्य उद्देश्य है:
- Hidden patterns खोजना
- Similar data points को एक साथ ग्रुप करना
- Dimensionality को घटाना
- Outlier या anomaly detect करना
🔬 प्रमुख Algorithms:
| Algorithm | उद्देश्य | उदाहरण |
|---|---|---|
| K-Means Clustering | Similarity के आधार पर group बनाना | Customer Segmentation |
| Hierarchical Clustering | Tree structure में grouping | Genetic Analysis |
| DBSCAN | Density-based clustering | Outlier Detection |
| PCA (Principal Component Analysis) | Dimensionality Reduction | Image Compression |
| Autoencoders | Feature Compression (DL-based) | Anomaly Detection |
| t-SNE / UMAP | Visualization (2D mapping) | Data Plotting |
🔷 1. K-Means Clustering
🎯 उद्देश्य:
डाटा को k समूहों (clusters) में बाँटना, जहाँ हर group का center “centroid” होता है।
📐 Mathematical Objective:
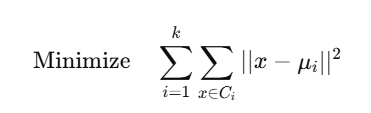
जहाँ:

✅ Python Code (Sklearn):
from sklearn.cluster import KMeans
import matplotlib.pyplot as plt

X = [[1,2], [1,4], [1,0], [10,2], [10,4], [10,0]]
model = KMeans(n_clusters=2)
model.fit(X)

print(model.labels_)     # Cluster IDs
print(model.cluster_centers_)

plt.scatter(*zip(*X), c=model.labels_)
plt.scatter(*zip(*model.cluster_centers_), c='red', marker='x')
plt.title("K-Means Clustering")
plt.show()
🔷 2. Hierarchical Clustering
📌 विशेषताएँ:
- Agglomerative: Bottom-up approach
- Dendrogram के रूप में output मिलता है
✅ Code (SciPy):
from scipy.cluster.hierarchy import dendrogram, linkage
import matplotlib.pyplot as plt

X = [[1,2], [2,3], [10,12], [11,14]]
Z = linkage(X, method='ward')

dendrogram(Z)
plt.title("Hierarchical Clustering Dendrogram")
plt.show()
🔷 3. DBSCAN (Density-Based Spatial Clustering)
📌 लाभ:
- Arbitrary shape के clusters बना सकता है
- Outliers को अलग कर सकता है
🔷 4. PCA (Principal Component Analysis)
📌 उद्देश्य:
High-dimensional data को कम dimensions में प्रोजेक्ट करना।
📐 PCA Formula:
Data matrix X को transform करते हैं: Z=XW
जहाँ:
- W: Principal components (eigenvectors of covariance matrix)
- Z: Reduced dimensional representation
✅ PCA Code:
from sklearn.decomposition import PCA
from sklearn.datasets import load_iris
import matplotlib.pyplot as plt

iris = load_iris()
X = iris.data
pca = PCA(n_components=2)
X_reduced = pca.fit_transform(X)

plt.scatter(X_reduced[:,0], X_reduced[:,1], c=iris.target)
plt.title("PCA of Iris Dataset")
plt.show()
📊 Summary Table:
| Algorithm | उद्देश्य | Output | Visualization |
|---|---|---|---|
| K-Means | Clustering | Cluster Labels | ✅ |
| Hierarchical | Clustering Tree (Dendrogram) | Cluster Tree | ✅ |
| DBSCAN | Density-Based Clustering | Labels + Outliers | ✅ |
| PCA | Dimension Reduction | Compressed Data | ✅ |
| Autoencoders | Neural Compression | Encoded Data | ❌ (Complex) |
📝 Practice Questions:
- Unsupervised Learning में labels क्यों नहीं होते?
- K-Means का objective function क्या है?
- PCA कैसे dimension को reduce करता है?
- DBSCAN और K-Means में क्या अंतर है?
- Hierarchical Clustering में Dendrogram क्या दर्शाता है?